


 Markets surged out of the gate Monday morning, with all three major U.S. indexes notching early gains. But after a bruising two-week rout on Wall Street, the question facing investors is whether stocks can sustain the rebound.
If Monday’s bounce is driven more by short-term bargain hunting than long-term conviction, then certain scans, like StockCharts’ Strong Uptrends to New Highs can help cut through the noise — flagging the outliers breaking key levels and showing enough momentum to possibly hold the upward move.
How I Scanned the Market at the Open
First stop: A high-level sweep of the S&P 500 using MarketCarpets to catch the early movers. From there, I drilled down into the sectors to see where real strength, or weakness, was taking shape.


FIGURE 1. MARKETCARPETS S&P 500 AND SECTOR VIEW. The S&P 500 view gives you a sea of green, but zooming into sectors, Consumer Discretionary (XLY) stands out above the rest.
Consumer Discretionary is outpacing all sectors, a signal worth noting. Instead of looking for leadership, I considered stocks hitting new highs, and then checking to see if any Discretionary names stand out from the pack.
So, next, I ran a Strong Uptrends To New Highs scan (you can find it in your scan library).


FIGURE 2, IMAGE OF THE SCAN AS IT APPEARS IN THE LIBRARY: This is one among numerous bullish scans you can run in StockCharts.
Only four stocks came up as a result. The most recognizable figure is Darden Restaurants, Inc. (DRI).
Darden Restaurants Stock: A Tasting Menu of Profits or Bloat
Even if you’re unfamiliar with the stock, you know Darden. Here’s a short list: Olive Garden, LongHorn Steakhouse, Yard House, Ruth’s Chris Steak House, Cheddar’s Scratch Kitchen, Chuy’s, Bahama Breeze, and a few more. Sound familiar?
DRI jumped after reporting strong fiscal Q3 results, with sales and EPS rising. The company also raised its full-year outlook and declared a $1.40 dividend; analysts also gave it an upgrade.
On the technical side of things, DRI also showed up on several other scan engines which appeared in the StockCharts Symbol Summary:
- Moved Above Upper Bollinger Band
- Moved Above Upper Price Channel
- P&F Double Top Breakout
- Moved Above Upper Keltner Channel
- New 52-week Highs
- P&F Spread Triple Top Breakout
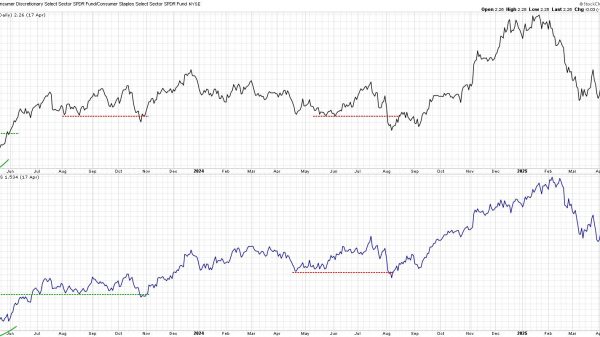
Let’s take a look at DRI’s relative performance against its sector (XLY) and the S&P 500 using PerfCharts.

FIGURE 3. PERFCHARTS OF DRI, XLY, AND $SPX. DRI’s outperformance is very recent, according to this chart.
This chart tells an interesting story. DRI has been the laggard for most of the last 12 months, though it began picking up steam as XLY began outpacing the S&P 500. As tariff fears brought XLY valuations down toward S&P levels, DRI maintained its valuations, and after a two-week dip, shot higher.
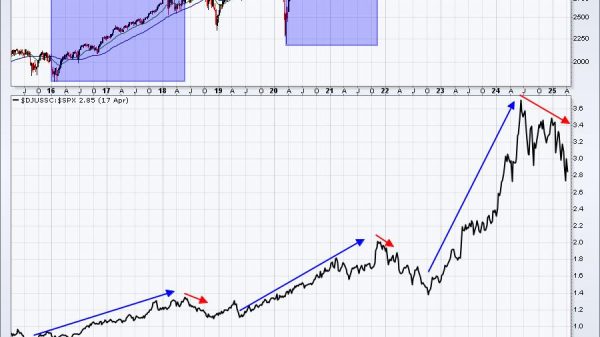
Let’s take a longer-term look using a weekly chart.

FIGURE 4. WEEKLY CHART OF DRI. The dotted line shows this week’s breakout to all-time highs.
So, what does this chart tell us relative to the PerfCharts above? First, while DRI has been underperforming XLY and the S&P over the last year (and longer than that if you extend the PerfCharts analysis period), the stock has been chugging along on a slow and steady, albeit volatile, uptrend, staying well above its 200-period simple moving average (SMA).
The StockCharts Technical Rank (SCTR) line shows you that DRI has had periods fluctuating from technical strength to weakness. I consider the 70-line signal, more or less, to be the strength threshold, and right now, the stock is at 92, an extremely bullish level. The question now is whether it can maintain its trajectory and if so, might there be an entry point for those who are bullish on the stock?
For that, let’s shift over to a daily chart.

FIGURE 5. DAILY CHART OF DRI. Watch the momentum and volume.
DRI has been marching steadily upward since the middle of last summer, with its recent push to all-time highs fueled by strong fundamentals. However, in terms of momentum and volume, the Money Flow Index (MFI), which is a volume-driven RSI of sorts, has been declining during DRI’s rise, signaling the potential for a pullback.
Whether DRI can sustain its current momentum remains to be seen. In the meantime, the Ichimoku Cloud can help anticipate and gauge any potential pullback, with a broad support zone forming below. The first key level to watch is $192, while $180 marks a critical support line — a close below that could open the door to further downside.
At the Close
This scan-driven approach began with a broad market view and drilled down to individual stocks that made new highs while others merely rebounded. DRI emerged as a standout: a fundamentally strong name hitting new highs while much of the market remains in recovery mode. Whether it continues to climb or pulls back toward support, tools like the Ichimoku Cloud and volume-based indicators can help you manage the risk and prepare for entry.

Disclaimer: This blog is for educational purposes only and should not be construed as financial advice. The ideas and strategies should never be used without first assessing your own personal and financial situation, or without consulting a financial professional.