


 Robinhood Markets, Inc. (HOOD) is back in the spotlight, wrestling with its four-year highs and turning heads on Wall Street. It debuted in 2021 as an IPO darling, capturing the imagination of young Gen Z traders before its dramatic fall as a meme stock fueled by crypto and an unhealthy dose of FOMO.
Now, with year-to-date gains outpacing the S&P 500 ($SPX), the former disruptor is looking to claim its space as a serious contender rather than a speculative fad.
Robinhood Stock’s Price Action: Breaking Out or Topping Out?
If you’ve been checking the StockCharts Technical Rank (SCTR) Reports, you’ve probably noticed the stock popping up on the Large Cap Top 10 list.

If you’re eyeing HOOD, you’re likely asking two key questions: How is it performing relative to its Financials sector peers, and how strong is the sector itself in terms of market breadth? Just as important, you’ll want a longer-term view: How has the stock held up over time, both on its own and compared to the broader S&P 500?
Let’s tackle all those questions in one shot.
Financial Sector Breadth Shows Bullish Tailwinds for HOOD
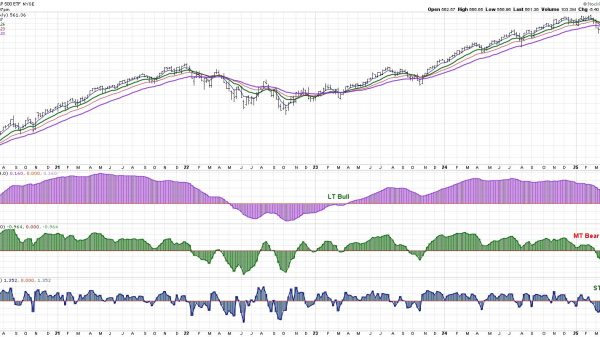
The chart below, which tracks the Financial Sector Bullish Percent Index, offers a quick read on sector strength and market positioning.
NOTE: The BPI spans three years.

FIGURE 2. FINANCIAL SECTOR BPI. Market breadth and comparative price performance look exceedingly bullish.
From a breadth perspective, the Financial sector looks bullish, bordering on overbought, with over 82% of the stocks within the sector triggering Point & Figure Buy Signals, according to its Bullish Percent Index (BPI) reading. Meanwhile, HOOD is crushing it on a 3-year relative basis—outperforming its sector by 250% and the S&P 500 by nearly 300%.
This paints a bullish picture. But before jumping to conclusions, let’s take a step back and look at HOOD’s price history, going back to when it IPO’d in 2021.
From Meme Craze to Measured Recovery
Check out the weekly chart below.

FIGURE 3. WEEKLY CHART OF HOOD. It’s above the 10-week and 40-week SMAs, but it has quite a distance to go before testing its yearly high.
You don’t need annotations to spot where HOOD’s meme-stock frenzy peaked and where the crash began, fueled by a sharp drop in retail trading activity, crypto market volatility, and intensifying regulatory pressure.
After basing for two years, HOOD began picking up steam in 2024. Its improving technical strength is reflected in the sharp spike of its SCTR, breaking above the 90 line. Fundamentally, HOOD began to recover as it started raking in profits, expanding its product lineup, and reigniting its user growth.
It’s trading above its 10-week and 40-week simple moving average (SMA), which is equivalent to a 50-day and 200-day SMA, respectively. Still, it has quite a way to go before testing its high of $66.90.
Short-Term Trading Setup
If you’re looking to buy HOOD, you’ll need to zoom in to find favorable entry points. Let’s switch over to a daily chart.

FIGURE 4. DAILY CHART OF HOOD. Support levels are clear and accumulation looks promising.
HOOD was in an intermediate-term downtrend starting in early February, where it peaked at $66.90, all the way down to the early part of April, where it bottomed sharply at around $29. HOOD quickly recovered, breaking above $50 (a local swing high) to $54, where it is now (at the time of writing).
Can HOOD Hold Its Gains or Is Consolidation Coming?
The Stochastic Oscillator warns that HOOD may be overbought and due for a pullback. Here are a couple of scenarios to consider, and note that the Ichimoku Cloud visually provides a wider range of potential support:
- Watch for support at $46 or $39, both recent swing lows.
- If it stalls between those levels, it could signal a failed breakout and continued consolidation until a new catalyst emerges.
- If it drops below $39, the next key level is at $29, but be a little cautious at that point, as such a deep retracement may indicate weakening momentum, sentiment, and fundamental weakness.
On the bullish side of things, the Accumulation/Distribution Line (ADL), currently well above the price, is indicating strong accumulation, suggesting that demand is outpacing supply—which, if it continues, can drive prices higher.
At the Close
Robinhood’s stock price is showing real signs of strength, not just on a chart, but in its fundamentals. With relative performance beating its sector and the S&P 500, and strong accumulation under the surface, HOOD’s comeback narrative is gaining technical validation. But with overbought signals flashing and key support levels in play, the next move may depend on whether bulls defend the breakout, or if the stock consolidates further while waiting for its next catalyst.
In either case, keep a close eye on volume, momentum shifts, and those support zones. HOOD may still have more room to run, but timing your entry could make all the difference.

Disclaimer: This blog is for educational purposes only and should not be construed as financial advice. The ideas and strategies should never be used without first assessing your personal and financial situation, or without consulting a financial professional.